
The seismic monitoring network
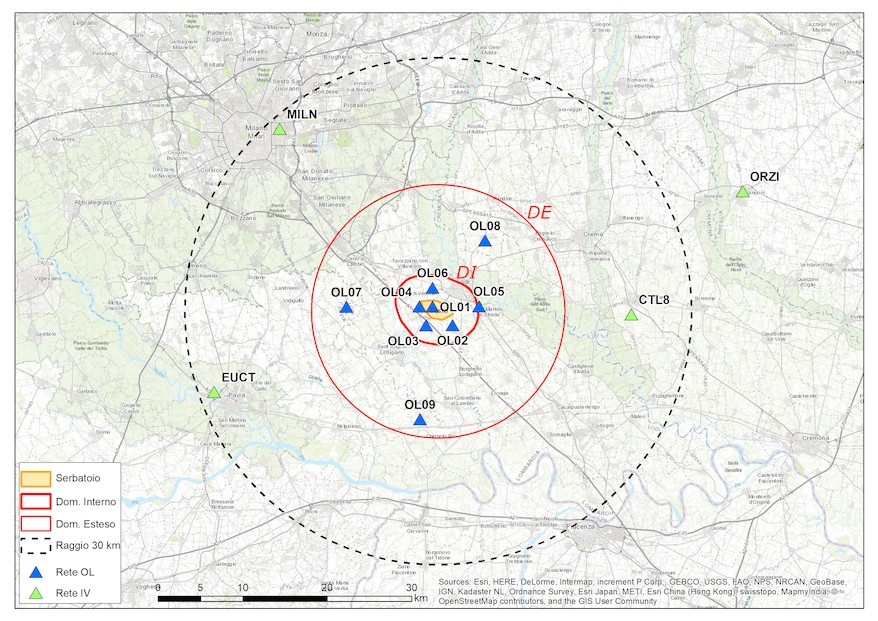
The Cornegliano Laudense Seismic Network (RSCL) consists of ten seismic stations and a permanent precision GNSS-GPS geodetic station focused on the Cornegliano Laudense gas storage reservoir. Seismic monitoring has been active since 1/1/2017.
The RSCL integrates some stations belonging to the regional seismic networks managed by OGS and the Centralized National Seismic Network (RSNC) managed by the National Institute of Geophysics and Volcanology (INGV); in this way, it is possible to detect seismic events, not perceivable by the population, which occur in all directions to a distance of a few tens of kilometres from the storage site.
All stations of the RSCL are equipped with a seismometer placed in a well to improve the quality of the detected signal and an accelerometer placed on the surface. The figure shows a map of the RSCL with highlighted domains of detection adopted by the monitoring system, according to the definitions in the MiSE Guidelines.
What is measured
The RSCL records ground vibrations caused by the passage of seismic waves. Since the instruments are very sensitive, all ground vibrations are detected, both those caused by earthquakes and those generated by other sources such as the transit of vehicles (trains, trucks, etc.), the activity of industrial machinery, weather events (wind, thunder, etc.) or explosions of quarry or war ordnance. A proper analysis of the signal generally allows discrimination among the different types of events.
The RSCL is able to detect seismic events of interest to the community (therefore perceivable with different intensities by the population) as well as events that are not perceived by local residents, whether these events are strong and distant earthquakes (for example, those that occur in Japan and Chile) or very weak tremors that occur near the network.
The monitoring system continuously acquires signals from the stations of the network and automatically analyses them to recognize any anomalies; if these variations are found simultaneously at multiple stations, the system locates the origin and quantifies the extent. If certain conditions are met, the phenomenon is declared a “seismic event”. All these steps occur within seconds of the signal being recorded.
The automatic system is calibrated mainly to recognize earthquakes, but it may happen that different phenomena or false events due to the random simultaneity of signal variations are also identified as seismic events. Since the main purpose of the RSCL is to record microseisms that are not identified by regional or national networks, the system has been calibrated to very high sensitivity thresholds, which means many false events may be detected. For this reason, all automatic determinations are reviewed by an expert seismologist who analyses the automatically identified events, confirming whether they actually correspond to local natural earthquakes or events potentially related to the activity of the storage facility.
What seismograms represent
The ground vibrations recorded by the instruments are usually represented with graphs, called seismograms, which describe the movement of the ground (in displacement, velocity or acceleration) as time passes. From the seismograms, it is possible to evaluate where the seismic event occurred, how strong it was and some of its other characteristics.
In the past, seismograms were plotted on paper and visually analysed. Today, digitized data are stored on electronic media and analysed through special programs to be interpreted or represented on video or printed on paper.
By way of illustration, some seismograms are represented below, as they appear in real time in the Seismograms in near real time section of this website or after they are processed by the staff in charge of their interpretation.
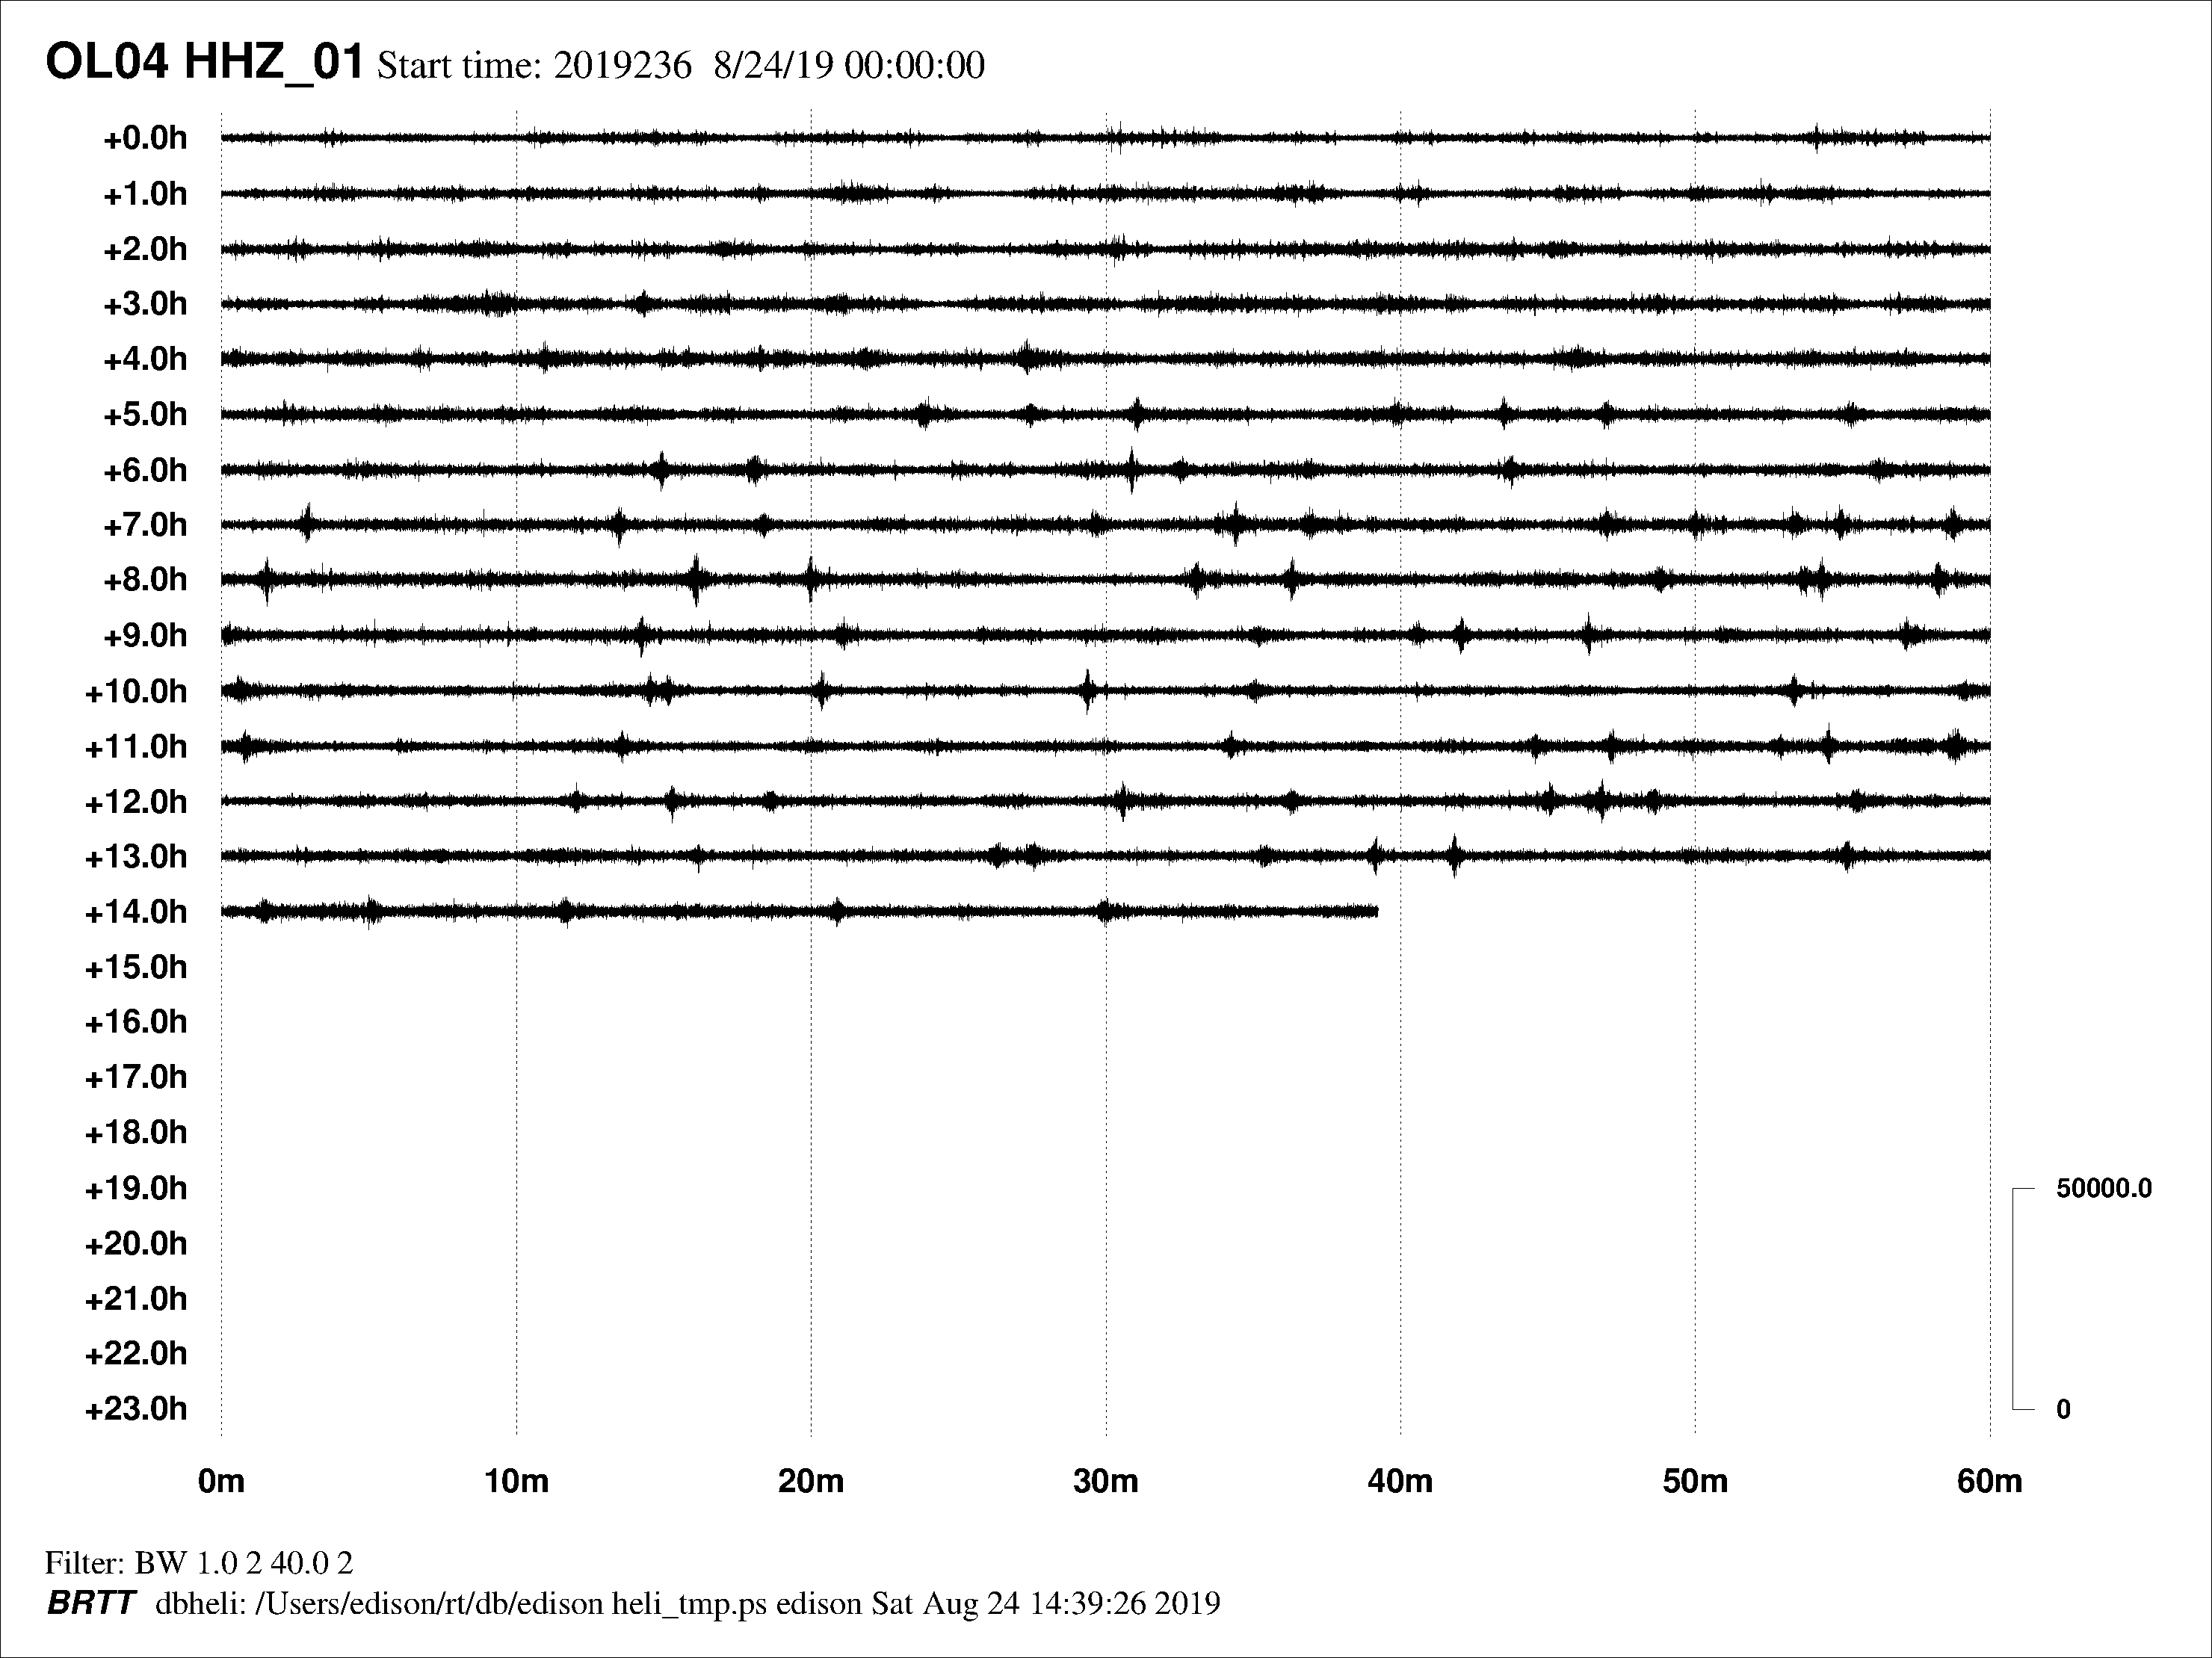
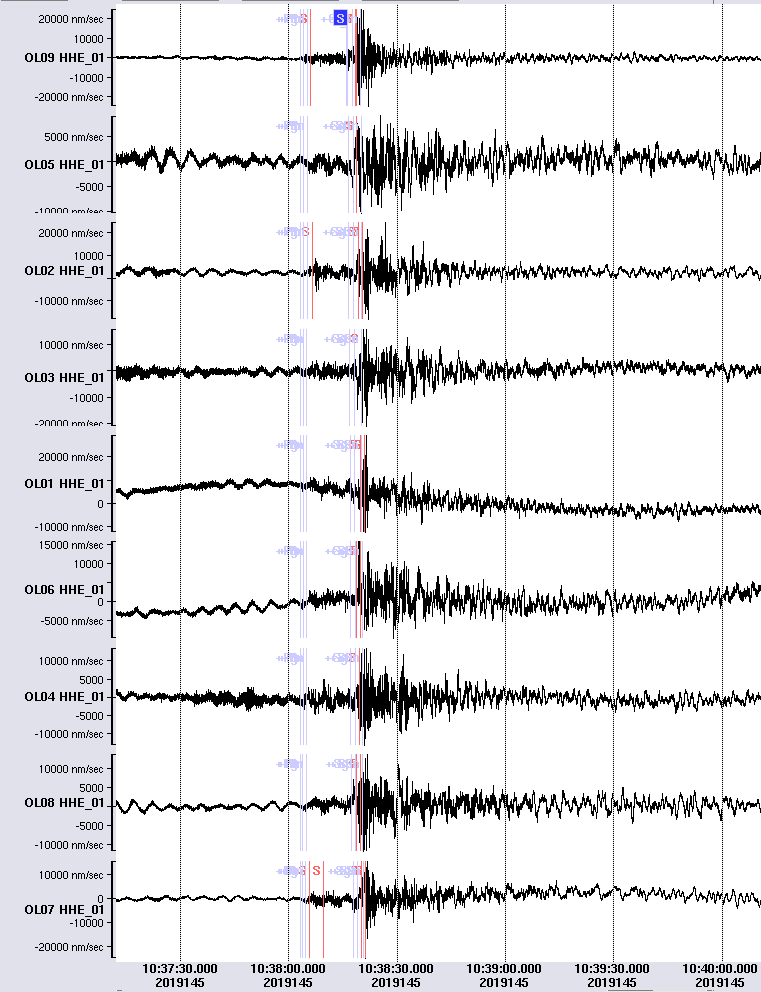
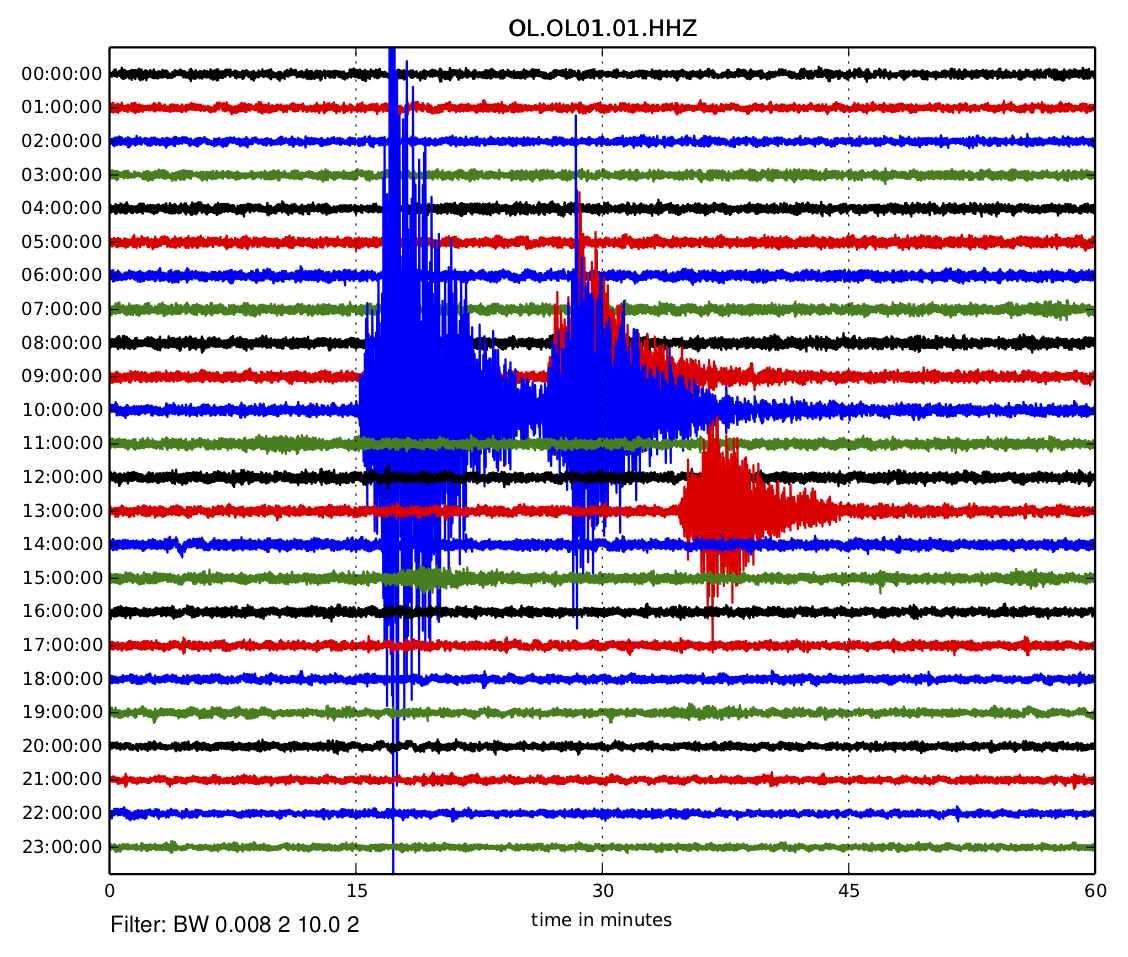
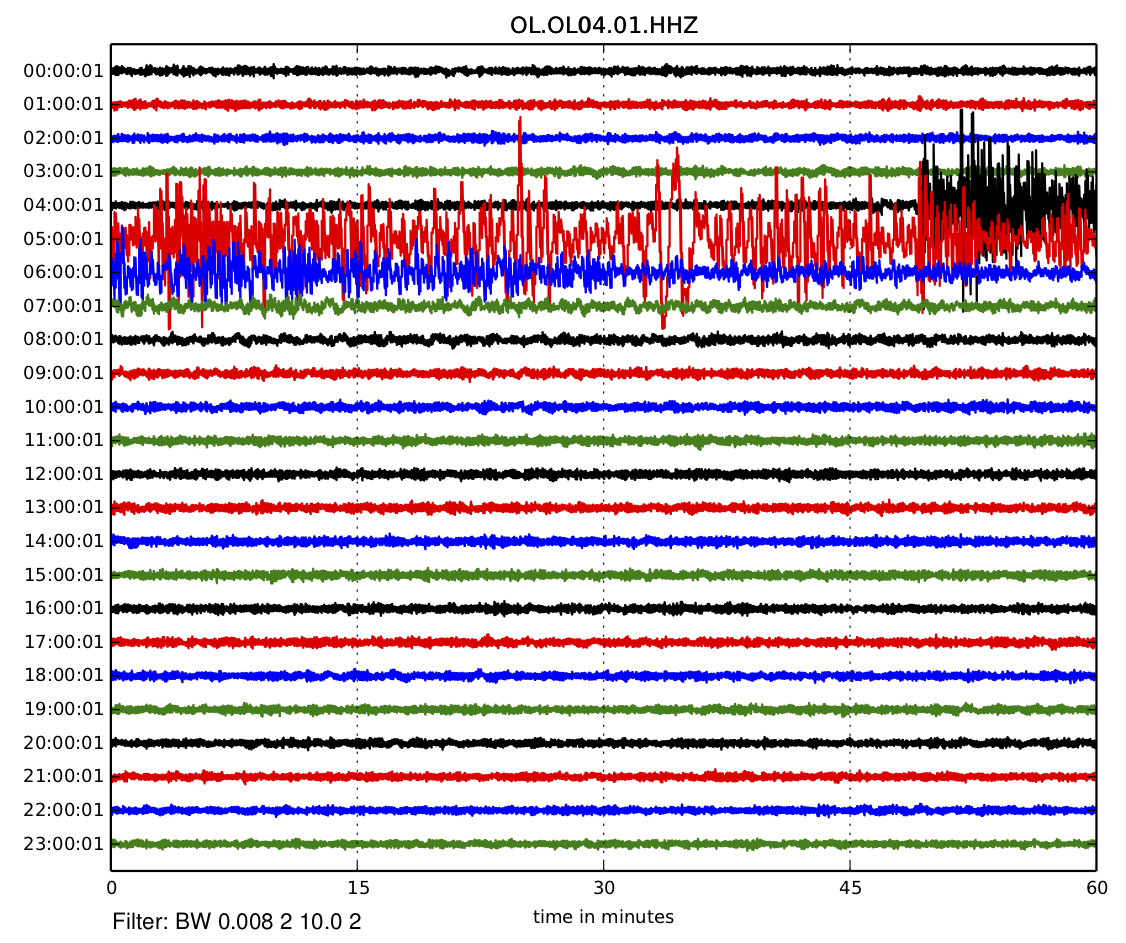
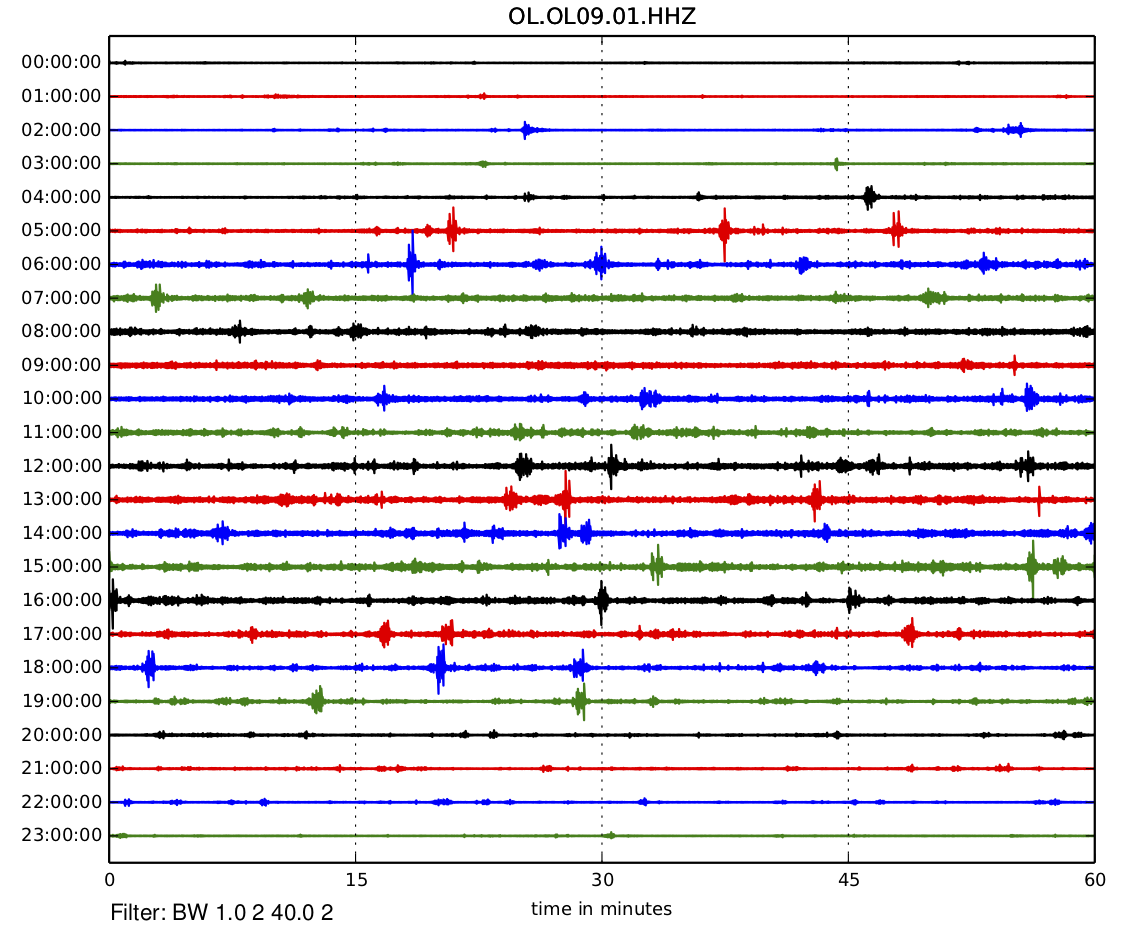
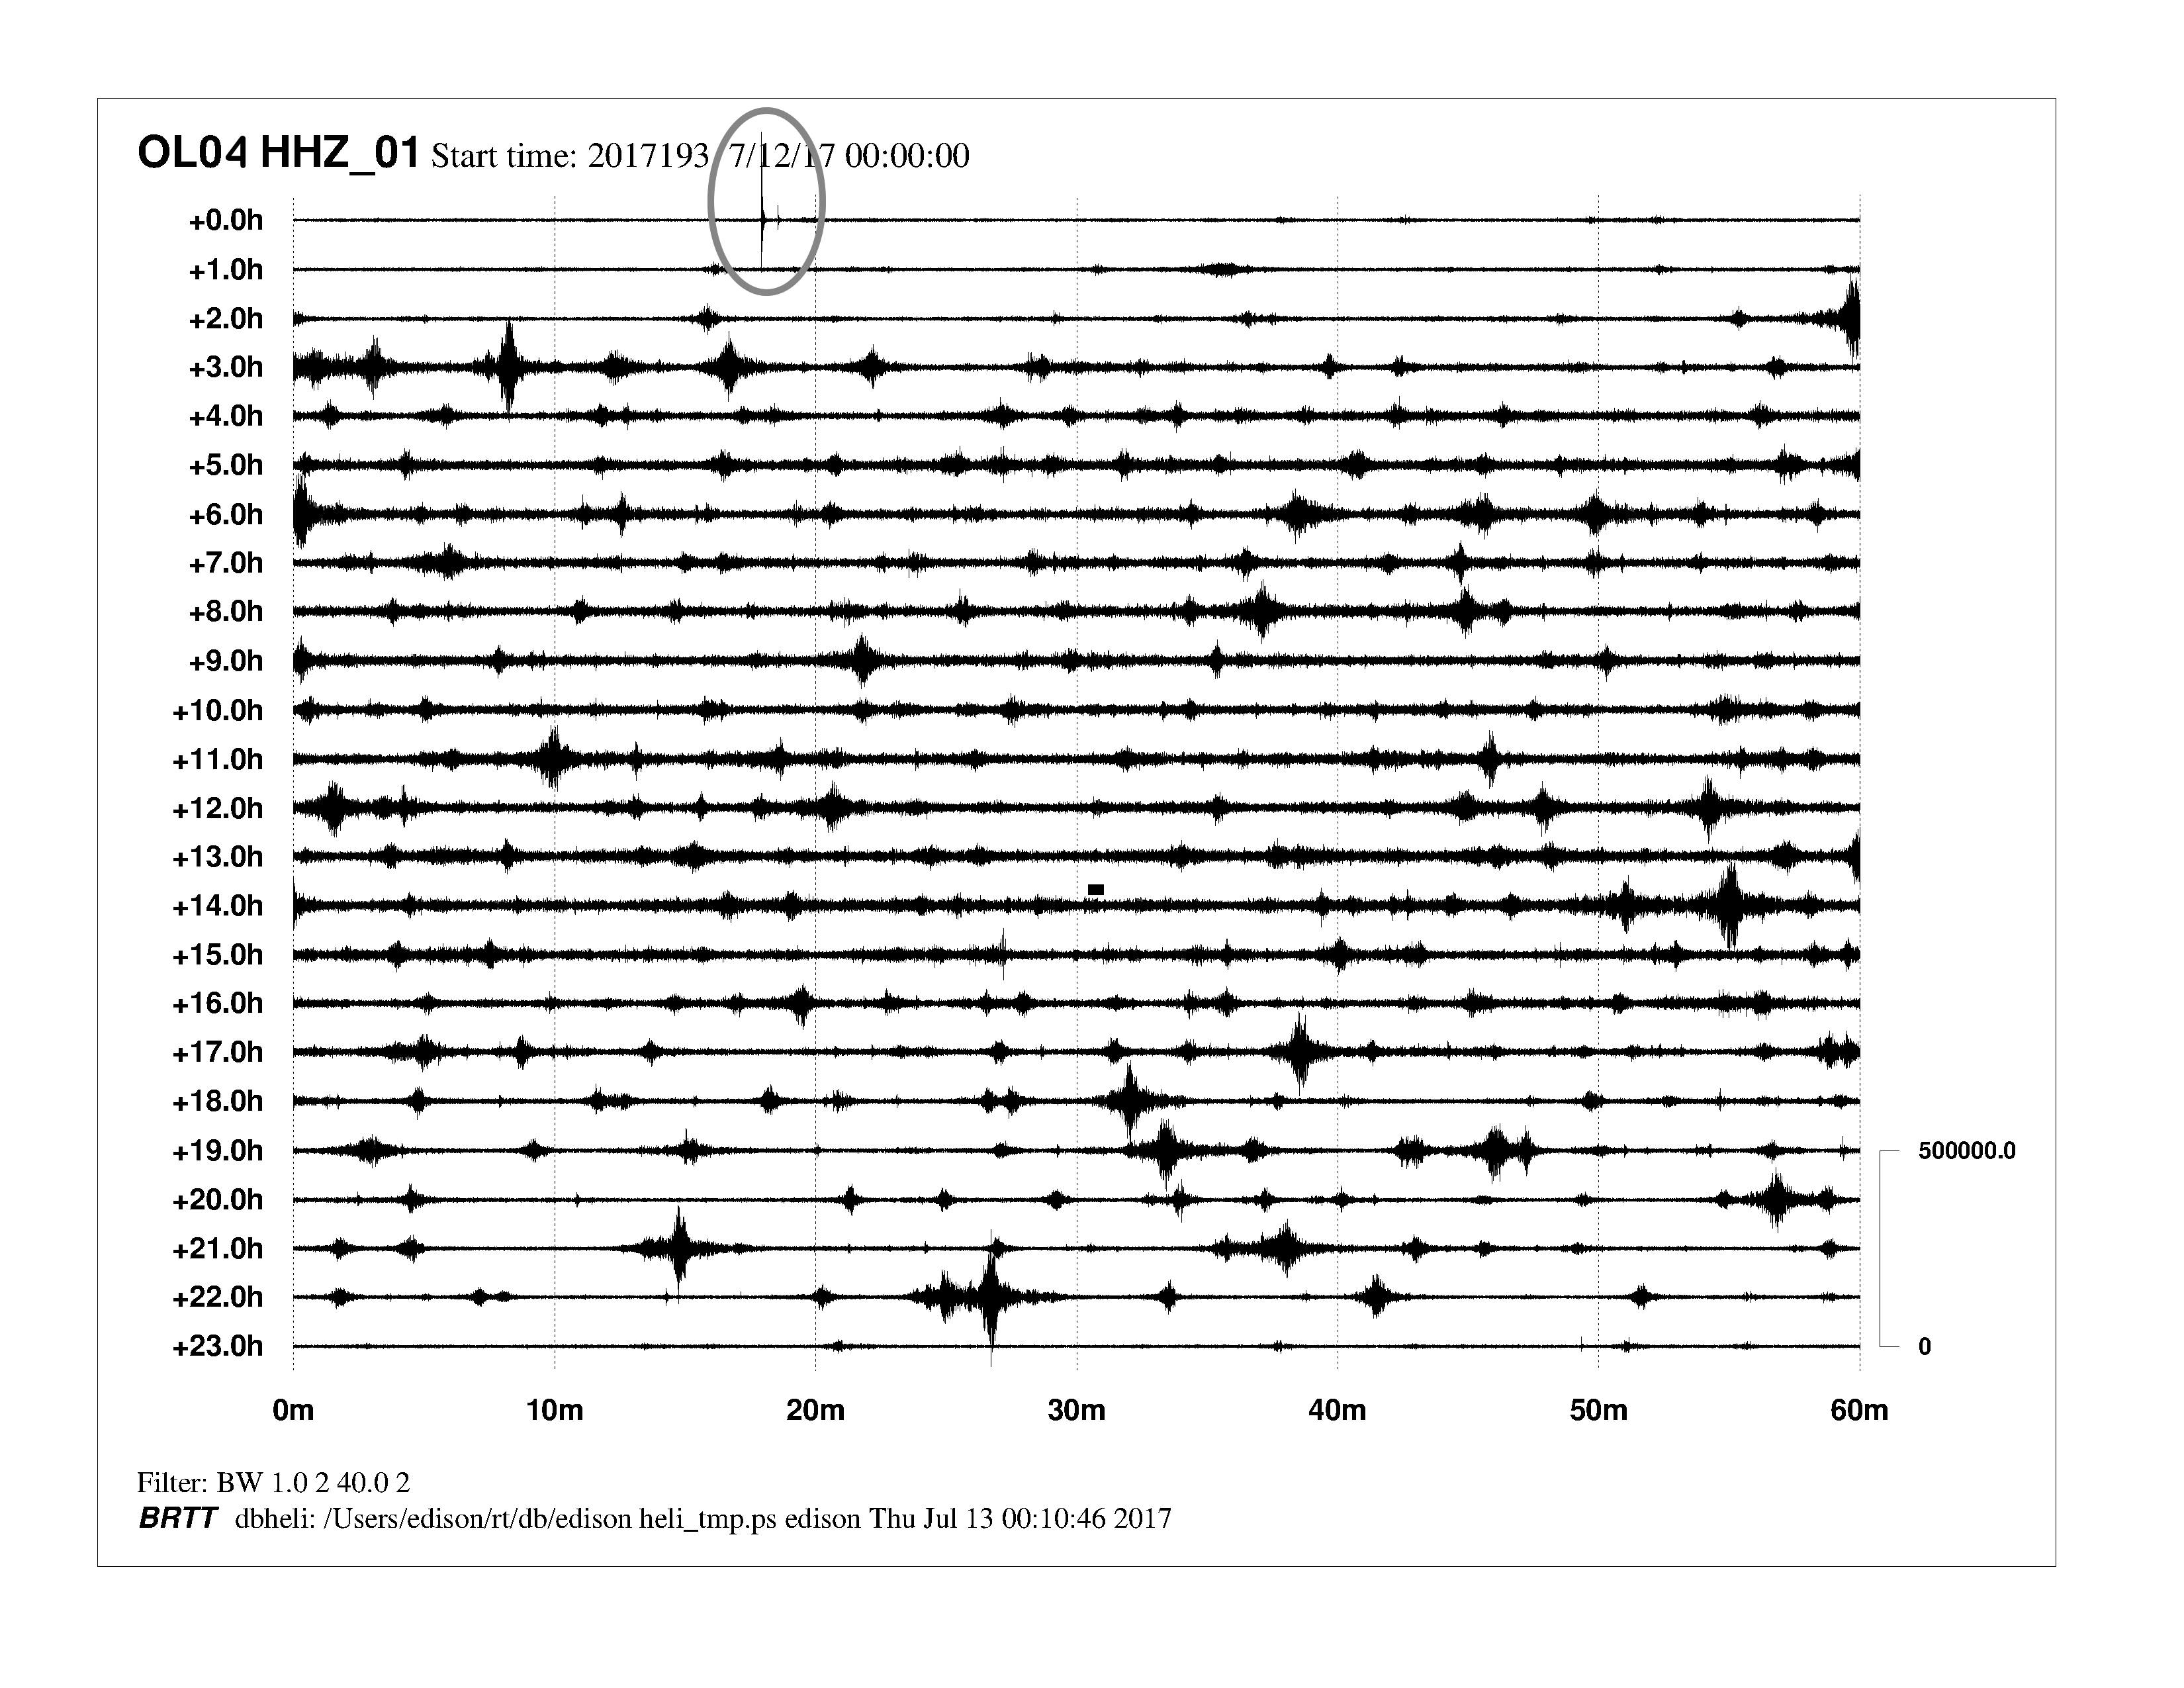
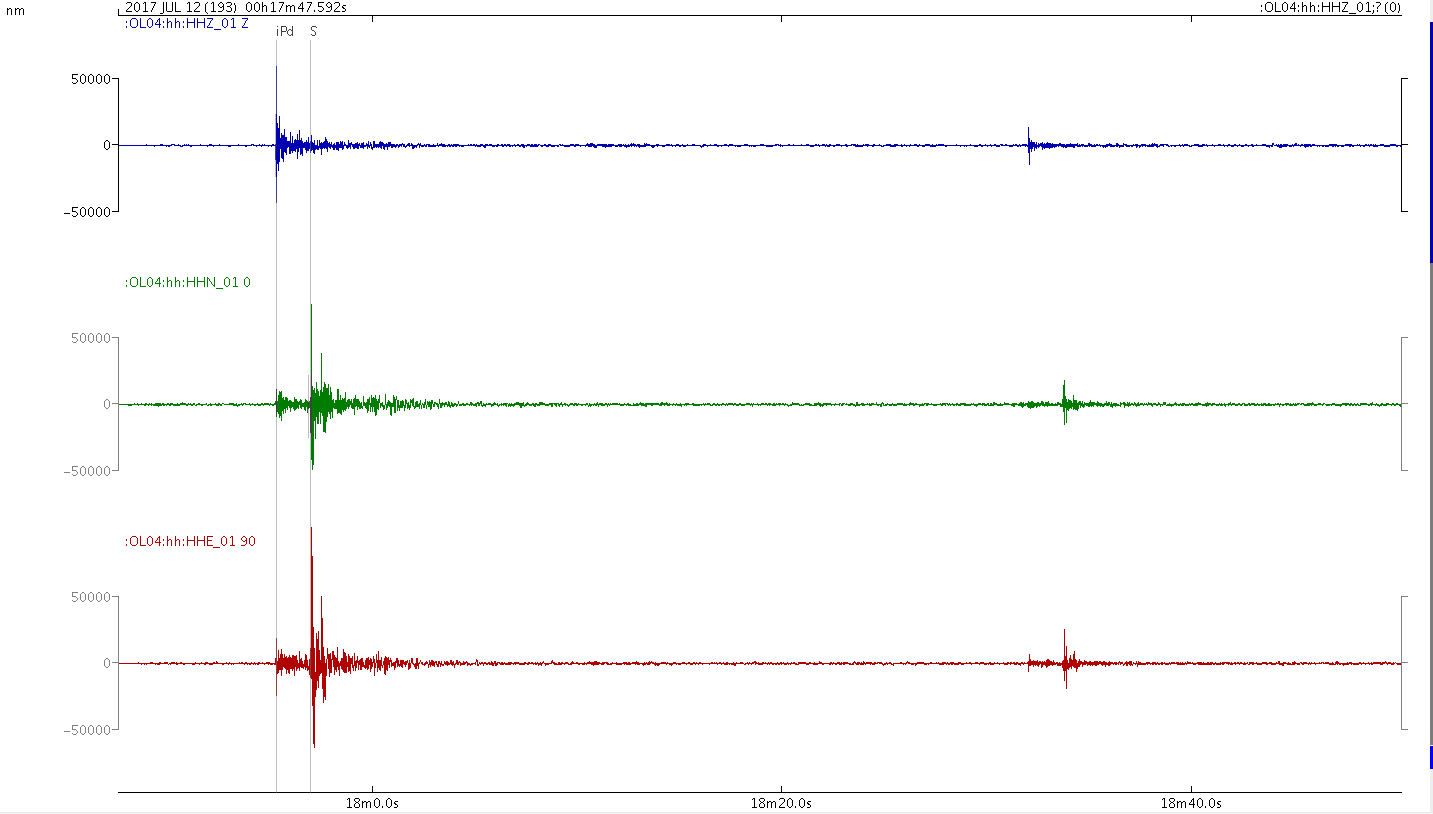
Below are some examples of signals recorded by RSCL related to different types of events. In order, these are as follows:
- seismograms related to a strong event that occurred in central Italy;
- seismograms from a strong distant event (“teleseism”) that occurred in the Pacific Ocean;
- signals due to trains in transit;
- recordings of two local microearthquakes.
What seismic monitoring is
Seismic monitoring is used to identify and measure seismic events in the vicinity of or potentially of interest for the Cornegliano Laudense gas storage facility called “Cornegliano Stoccaggio”.
If the vibration of the ground automatically identified within a few seconds by the system as a ‘seismic event’ corresponds to a local earthquake and has certain characteristics, the seismologist on call at OGS is alerted; within a few hours, the intervention and manual analysis of the data confirm or eliminate the event. The location and magnitude of the event is finally published on the page of the integrated monitoring system containing the “Recent Events”. In the case of “attention conditions”, the operator of the storage facility is notified promptly.
“Attention conditions” are situations in which there is an abnormal increase in microseismicity (in terms of magnitude and/or number of events detected) compared to conditions considered “normal” within the detection domains (the so-called seismic background). In this case, the seismologist in charge of monitoring intensifies the controls and analysis to obtain an accurate and updated picture of the detected microseismicity and verifies with the storage manager the activity carried out to establish or exclude any correlation between the storage facility and the detected microseismicity.
The Cornegliano Stoccaggio monitoring website provides complete information on the stations of the seismic network, graphs, technical and scientific documents and reports on the activity carried out. Further details can be found in the section with frequently asked questions (FAQ).